(Originally Posted on Plan Washington Website)
The Washington Business Alliance developed the Washington State GHG Reduction Explorer to project the outcomes of various policy proposals that tax/regulate greenhouse gas emissions. The software is based on the Carbon Tax Assessment Model (CTAM) maintained by the Washington State Energy Office. The GHG Reduction Explorer incorporates slight modifications to CTAM, and adds functionality to consider the impact on greenhouse gas emissions and revenue collection of dedicating revenue to invest in carbon reduction projects. The model incorporates the Department of Ecology Clean Air Rule (CAR) and considers overlap between emissions reductions achieved with the simultaneous implementation of CAR and a carbon price. The Washington Business Alliance will provide reports on all relevant proposals before the legislature.
- Assumptions: Exemptions in place for Energy-Intensive Trade-Exposed industries (EITEs), marine fuel and jet fuel, transit & agriculture. Estimate that 63% of revenue goes into Clean Energy Fund; [1]
- Revenue totals and emissions reduction effectiveness: The cost-effectiveness of the investments is a major uncertainty, and also a primary determinant of the total emissions reductions and by extension revenue collected. The model in current form is best applied as a what-if framework to address questions like how cost-effective the Clean Energy Account would need to be to hit certain targets and/or prevent the price for escalating at the maximum rate. [2] We evaluate two scenarios for this analysis: one with what we believe are relatively optimistic assumptions about Clean Energy Account investments and one with what we believe are relatively pessimistic assumptions about the Clean Energy Account investment cost-effectiveness.
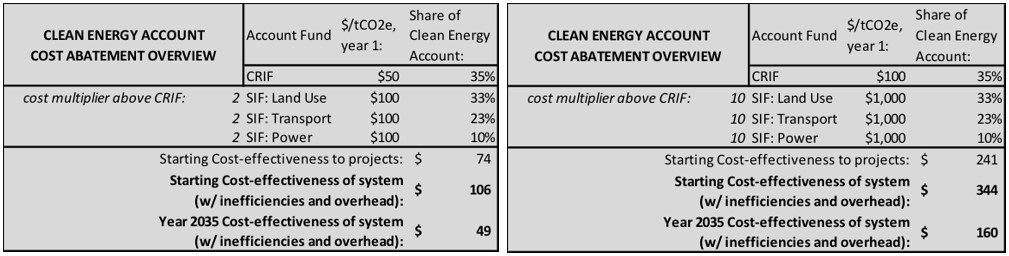
- Optimistic scenario: Lacking more information than the bill provides, we make an assumption that the Carbon Reduction Investment Fund (CRIF) starts at $50/tCO2e and is 70% efficient in allocating funds, all other Clean Energy Account funds are distributed at double the cost per tCO2e as the CRIF. This is not a best estimate, just a starting point: CRIF projects are funded from the first year at well under the $100/tCO2e maximum described in the bill while all other drop below this threshold by 2025 or sooner (Table 1);
- Pessimistic scenario: CRIF only funds projects at the maximum abatement cost specified in the bill language ($100/tCO2e to the project, with additional system inefficiencies), while the other Clean Energy Account Funds are much less cost-effective at reducing CO2 – ten times that of the CRF (Table 2). [3]
- Even in the optimistic Clean Energy Account case, the carbon price would likely rise at the maximum allowed rate (7% per year) through at least 2035. Emissions do not project to reach the adjusted, more ambitious emissions limits in 2035.
Tables 1 and 2: Investment cost-effectiveness in “Optimitic Scenario” (left) and “Pessimistic Scenario” (right)
Optimistic Scenario
The carbon price and Clean Air Rule provide 210 MtCO2e of emissions reduction, while investments total another 156 MtCO2e through 2035. The total is 366 MtCO2e (see first chart), which is enough to exceed on-statue emissions limits by ~30%, but remains ~15% short of the adjusted emissions limits specified in this bill. The Clean Air Rule alone as written is projected to reduce an estimated 173 MtCO2e, meaning this legislation would provide an additional 193 MtCO2e.
Table 3: Carbon Price annual revenues by biennium (in real, $2018 USD), Optimistic Scenario

Figure 1: Optimistic Scenario with HB1646 in addition to the Clean Air Rule

Figure 3: Optimistic Scenario with HB1646, standalone impact [4]

Pessimistic scenario
The carbon price and Clean Air Rule provide 210 MtCO2e of emissions reduction, while investments total another 51 MtCO2e through 2035. The total is 261 MtCO2e (see first chart), which falls short of on-statue emissions limits by ~5% and is ~40% short of the adjusted emissions limits specified in this bill. The Clean Air Rule alone as written is projected to reduce an estimated 173 MtCO2e, meaning this legislation would provide an additional 92 MtCO2e.
Table 4: Carbon Price annual revenues by biennium (in real, $2018 USD), Pessimistic Scenario

Figure 3: Pessimistic Scenario with HB1646 in addition to the Clean Air Rule

Figure 4: Pessimistic Scenario with HB1646, standalone impact [5]

House Bill 1646 Policy Parameters
- Carbon Pollution Mitigation Tax: $15/tCO2-equivalent as of July 1, 2018.
- Price increases initially at and never to exceed 7% annually in July (variable down to 0% depending on pace of greenhouse gas emissions reductions). Includes certain exemptions, most notably from an emissions coverage perspective aviation and maritime through 2021.
- RCW 70.235.020 limits become: must (not shall) limit emissions to 40% below 1990 levels (rather than 25%) by 2035, and 80% below 1990 (rather than 50%) by 2050.
- Revenue allocation:
- Equitable Transition Fund: $50 million in first year and “additional money allocated over time as necessary”;
- Administrative Expenses: Capped at 5% of the receipts received from the tax.
- Clean Energy Account: After above allocation, seventy percent (70%) of remaining revenues deposited into Clean Energy Account
- Sustainable Infrastructure Fund Subaccount: Receives 65% of Clean Energy Account revenue[6], with 35% of this to transportation projects, 50% to land use projects, and 15% for eligible power sector projects. Carbon Reduction Investment Fund Subaccount: Receives 35% of Clean Energy Account revenue, and “may not exceed one hundred dollars in 2017 dollars per ton of carbon dioxide equivalent of reduced emissions of greenhouse gases.”
- After ETF and Admin distribution, twenty percent (20%) of these remaining revenues to Clean Water Climate Program Account, and ten percent (10%) to Sustainable Forest Health Account.
- Overlay Investment Criteria: At least 25% of expenditures for projects or activities with direct benefits and 10% located within disproportionately impacted communities.
- Low-income carbon pollution mitigation tax grant: Maximum $300 per household based on adjusted gross income reported on federal personal income tax.
endnotes
[1] Satisfies 70% of remaining revenue after $50 million to ETF plus 5% administration fee.[2] We note also no revenue allocation to “Low-income carbon pollution mitigation tax grant” OR revenue generated from emissions other than energy-related CO2 (e.g. industrial process, waste, agricultural, methane) are modeled. A higher or lower allocation to ETF is possible, as it is uncapped. This would have some impact on the revenue and emissions reductions outcome of either scenario.
[3] Bill language regarding SIF revenue: “Must be used for greenhouse gas emission reduction projects in Washington that achieve indirect carbon reduction, have long-term or difficult to quantify emission reduction prospects, or that would not be cost-competitive with projects funded under the carbon reduction investment fund where the primary performance metric for comparing projects is cost-per-ton of greenhouse gas emissions reduced.”
[4] The carbon price and CAR would result in a substantial overlap of emissions reductions, which would occur under either program but cannot occur twice. Accounting for these duplicate emissions reductions, the emissions reductions in the absence of the CAR are projected to be 254 MtCO2e (second figure)
[5] The carbon price and CAR would result in a substantial overlap of emissions reductions, which would occur under either program but cannot occur twice. Accounting for these duplicate emissions reductions, the emissions reductions in the absence of the CAR are projected to be 138 MtCO2e (second figure)
[6] Must be used for greenhouse gas emission reduction projects in Washington that achieve indirect carbon reduction, have long-term or difficult to quantify emission reduction prospects, or that would not be cost-competitive with projects funded under the carbon reduction investment fund where the primary performance metric for comparing projects is cost-per-ton of greenhouse gas emissions reduced.”