Research Highlights

UPDATED: Effect on GHG Emissions and Rates from 100% Clean Power
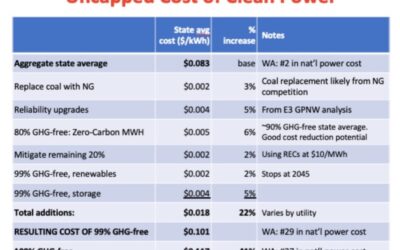
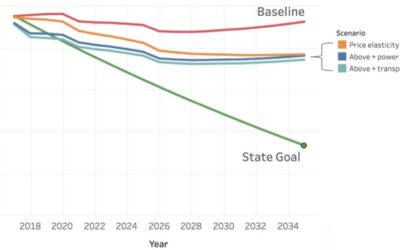
This updated Clean & Prosperous Institute (CaPI) analysis examines the rate impacts of eliminating coal power, achieving an 80% clean energy standard by the year 2030, and a 100% clean energy standard by the year 2045. CaPI relies on a variety of sources, and deploys its own utility-specific model.
Analysis: Cost and Rate Impact of 100% Clean Energy
This analysis examines the rate impacts of eliminating coal power, achieving an 80% clean energy standard by the year 2030, and a 100% clean energy standard by the year 2045. CaPI relies on a variety of sources, and deploys its own utility-specific model.
Kalama Methanol Plant – Review of Greenhouse Gas Impact Assessments
Click Following Link For Full Report CaPI_KMMEF_GHG_Analysis_12-13_FullReport Kalama Methanol Plant Offers Strong Prospects for Net Global Greenhouse Gas Reduction Benefits Analysis published by the Clean & Prosperous Institute shows new industrial facilities can...
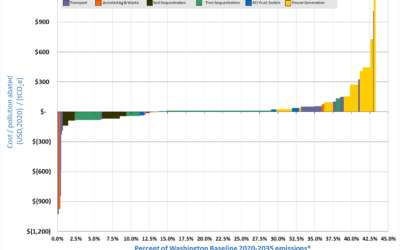
Visualizing cost-managed approaches to reducing WA emissions
To date, there is no Washington Specific MAC Curve that provides more than a cursory glance at carbon reduction measures specific to our state. The Clean & Prosperous Institute (CaPI) has decided that the time has come to undertake a more comprehensive, statewide look at MAC opportunities in our state. CaPI is actively looking for partners and funders to carry this project through to a robust tool for policymakers and businesses.
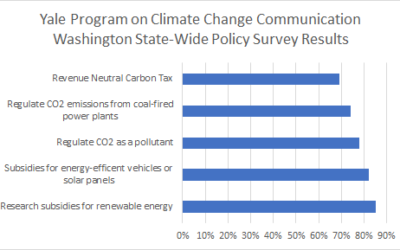
Review of Climate Policy Options
Evaluating regulations, subsidies, pricing mechanisms, and hybrid policies Abstract: There is a growing recognition among businesses, policymakers, and the general public regarding the economic and societal risks of climate change. The latest, most urgent...
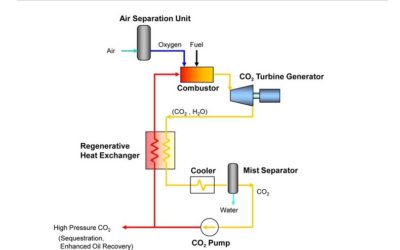
Volcanoes, Forests, and Farms: A Carbon Policy That Works for Washington—and Puts All of Washington to Work
We absolutely must sequester carbon on a large scale, and this technology is one of several with the potential to implement Plan B — carbon negativity. Washington is possibly the best region in the world do to so economically. The combination of Washington’s biomass-producing industries and unique geologic formations make us uniquely well suited to the task.

Wasted energy: Increasing efficiency can reverse a major drag on Washington’s prosperity
Clean & Prosperous Institute (CaPI) analysis indicates that Washingtonians spent over $24 billion on energy in 2015 – down from nearly $28 billion in 2014 – with nearly 60% ($13 billion) spent on wasted energy. Efficiency gains are an opportunity to generate immediate economic benefit and foster a clean technology boom.

Wasted energy: Ten opportunities to reduce a $13 billion annual bill
Clean technology can boost energy efficiency, reduce waste, and save Washington State billions of dollars annually, while developing a competitive advantage in a multi-trillion dollar industry. Here’s a sample of some significant strategies to make this happen.
Appendix: Wasted Energy additional details
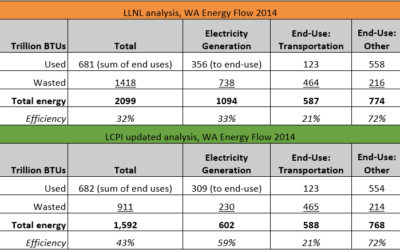
Section 1: Updating the Sankey diagram
Sankey Diagrams, like those produced by LLNL, are an information-rich visual depiction of energy or other (e.g. carbon, money) flows from inputs to final use.
Section 2: Carbon content of wasted energy
CaPI analysis estimates around 50 million metric tons of carbon dioxide (MtCO2) associated with wasted energy in 2015.
The Business View on I-732
As voters consider I-732 this election, it’s important to have accurate information on this initiative, the first in our nation proposing a carbon tax. Much has been written about I-732, some of it inaccurate.

Washington Solar Policy: Impact and Gaps
A 2014 survey by Solar Washington, published by the CleanTech Alliance, states: “Results from the data show that for every dollar of the Washington State solar incentive redirected to PV system owners, the state sees $2.46 injected back into the local economy. Based on data collected reflecting business activity in 2013, $48.2 million would be injected into the economy as a result of the $19.6M that the state will pay out in solar incentives.” In 2013 the production incentives were used to the tune of $2.8 million. Those small businesses and homeowners will receive an estimated $19.6M from their utilities in further incentive payments over the course of the program.
Consumer Appeal, Risks and Choices
In this blog post, I’ll review solar’s unique attributes that are not currently captured in the price of solar, as measured through RECRIP and net metering.